As usual, we compare the returns of our own profiles for the third quarter of 2024 with the ProNL Index over that same third quarter. The ProNL Index is a benchmark by investment manager comparison platform Finner, which reflects the average return of investment managers in the Netherlands across five different risk profiles. Once again, we see notable differences, which we are happy to explain stoically, based on hard facts.
Below you can see the chart in which we compare our returns from January through the end of September 2024 with the ProNL index for the different profiles. Stoic scores higher across the board, except in the defensive profile, where Stoic 30 performs slightly worse and Stoic 40 performs better. In the ‘very defensive’ profile, Stoic 10 performs worse, while Stoic 20 performs better.
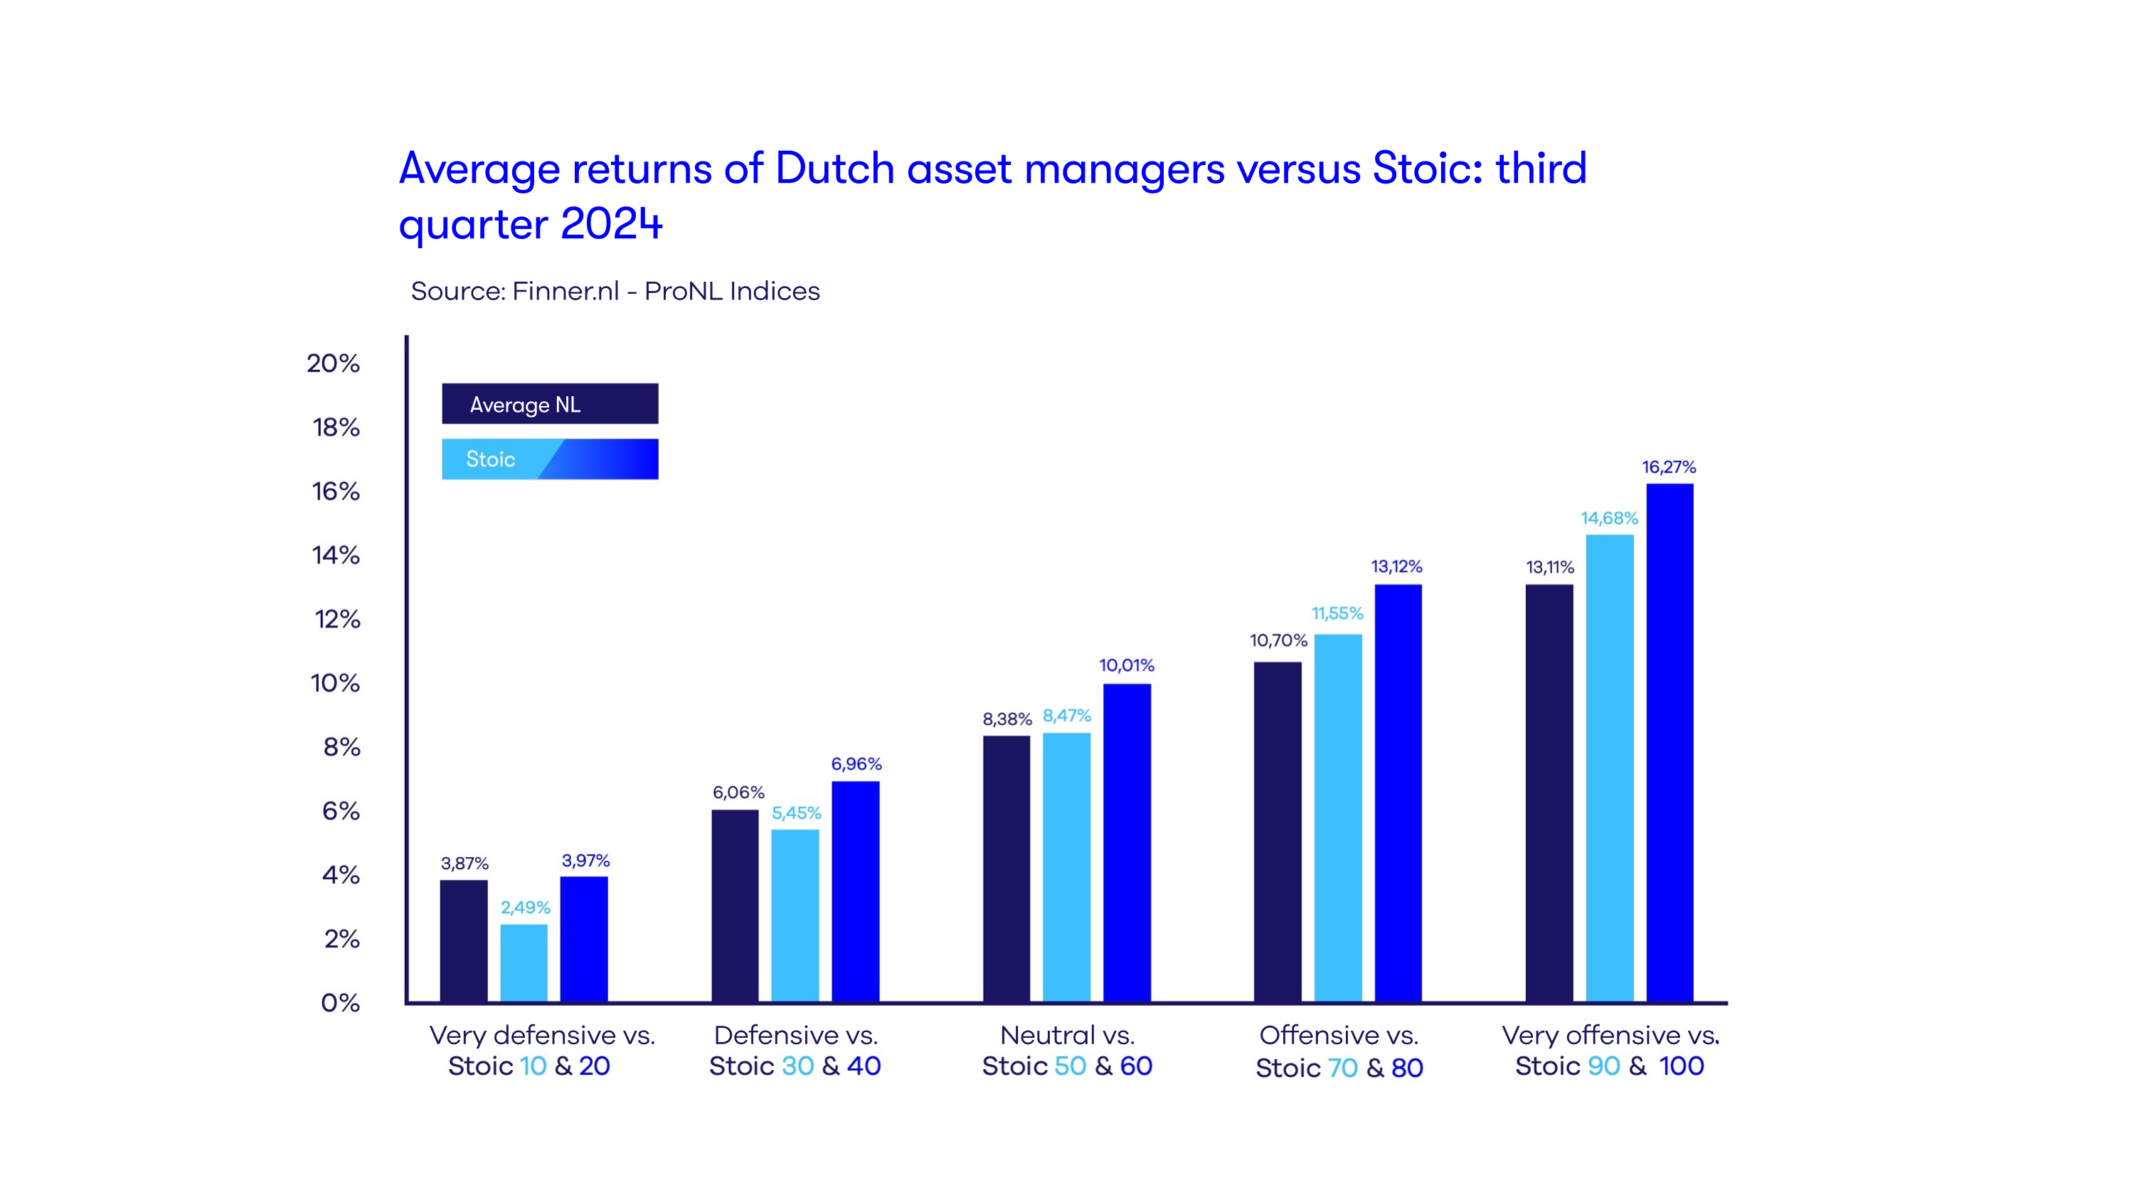
Why do two profiles underperform compared to the very defensive and defensive portfolios? Because comparing a ‘very defensive’ profile with Stoic 10— which consists of 10% equities and 90% low-risk government bonds — essentially amounts to comparing apples and oranges. The same goes for comparing the ‘defensive’ profile with Stoic 30, consisting of 30% equities and 70% low-risk government bonds. Many investment managers artificially boost the return in their very defensive and defensive profiles. They may invest in bonds – otherwise, they couldn’t label it ‘defensive’ – but these are often much riskier variants. As a result, returns are higher during good times. For this reason, it is fairer to compare Stoic 20 with ‘very defensive’ and Stoic 40 with ‘defensive’: that is comparing apples to apples. And in both cases, we perform better.
Looking at the long term.
But the long term is of course much more important. Anyone can get ‘lucky’ or ‘unlucky’ on the market at some point, which is immediately reflected in the quarterly figures. But over time, luck and bad luck average out. And we see that Stoic consistently achieves better returns in every profile than the average Dutch investment manager according to the ProNL index.
The defensive profiles.
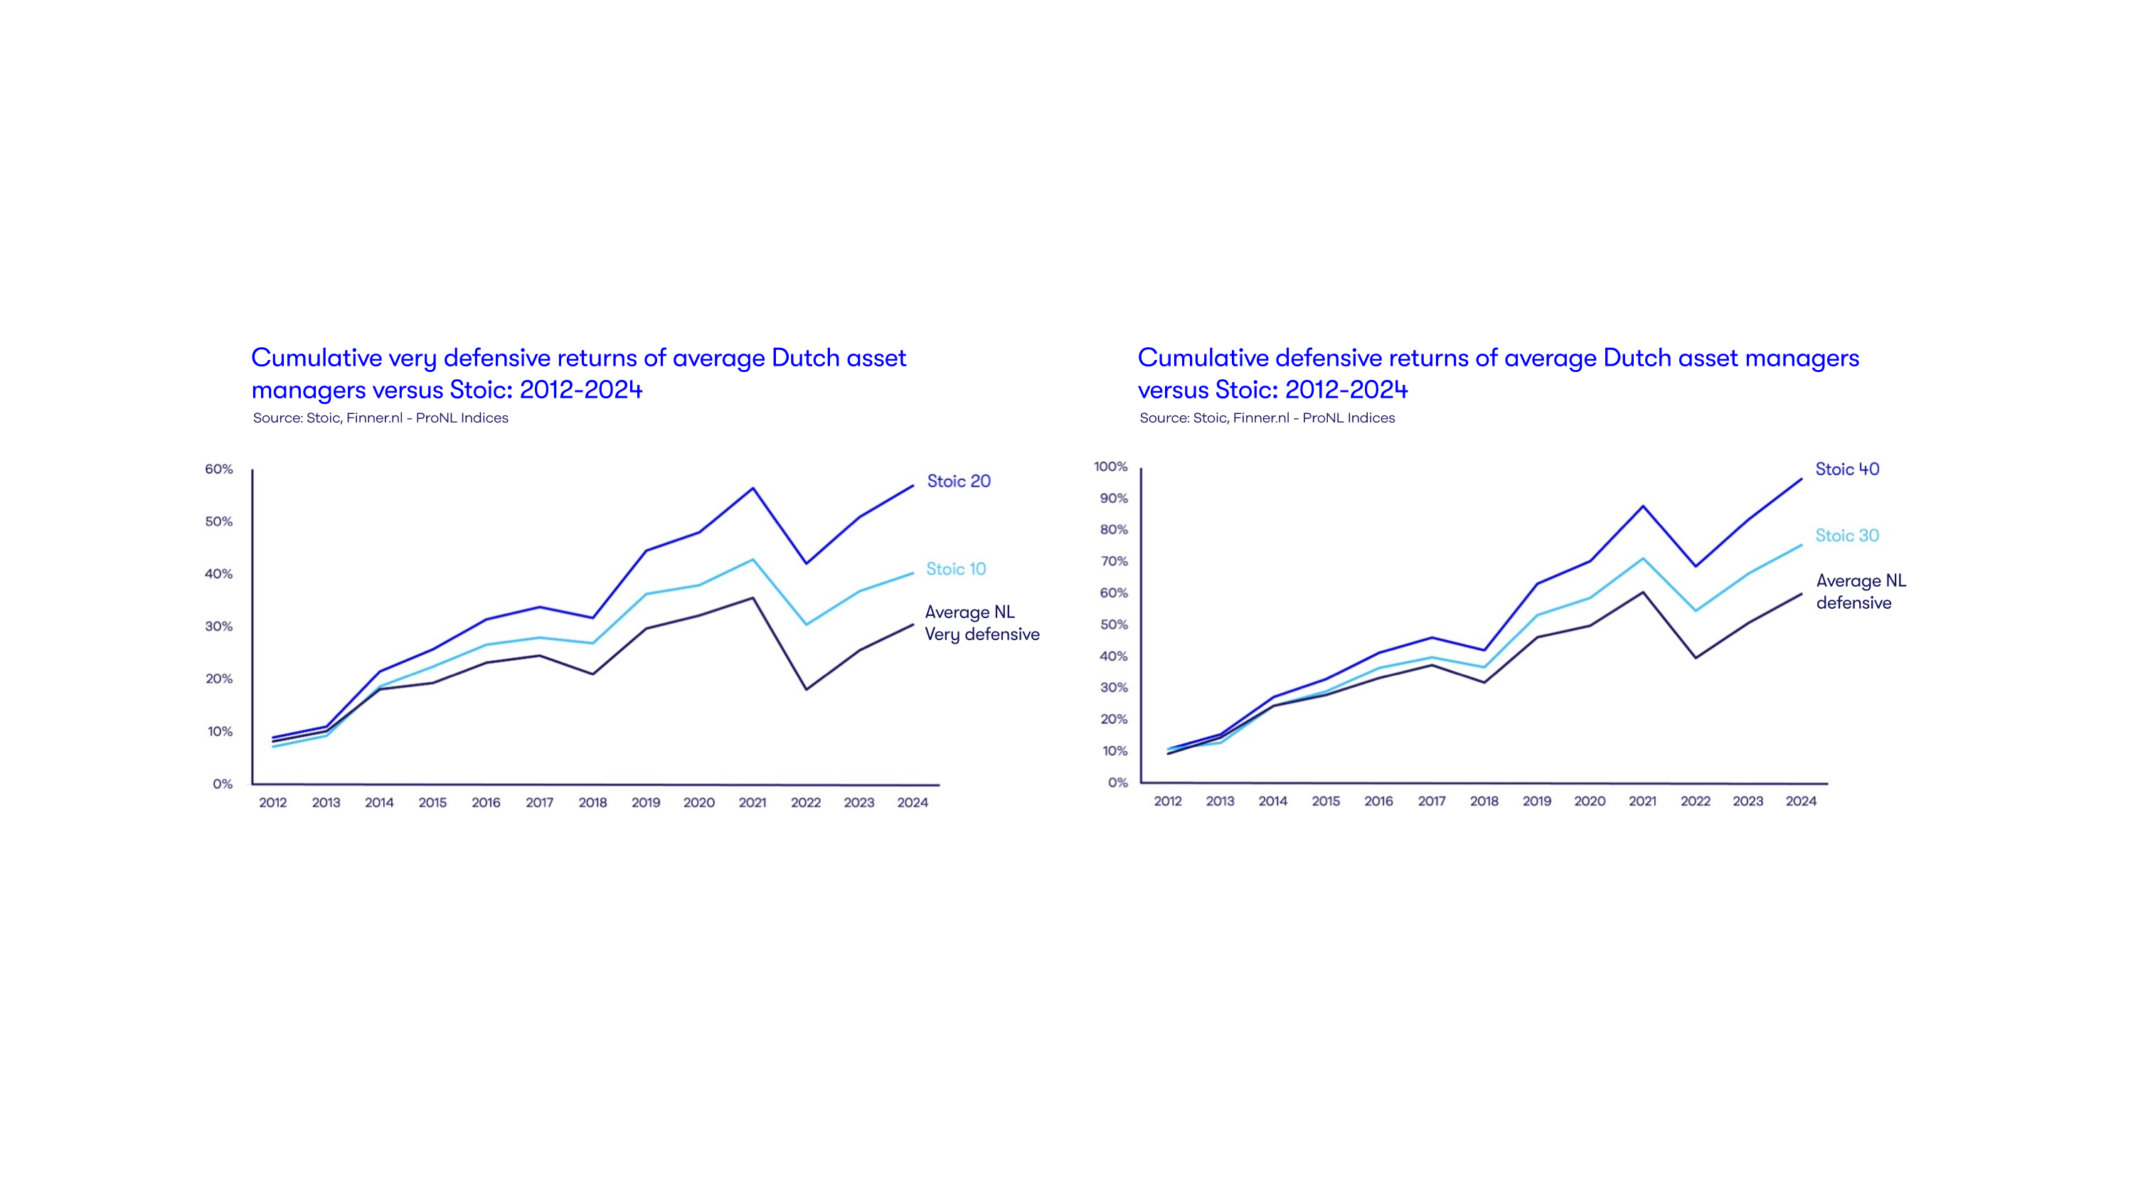
Stoic performs better over the long term in the ‘very defensive’ and ‘defensive’ profiles. For example, the return from 2012 to the end of Q3 2024 for Stoic 10 is 40.29%, and for Stoic 20, it is 57.01%. That’s significantly more than the ‘very defensive’ ProNL index, which returned 30.48%.
Defensive in concrete amounts.
€1,000,000 invested in 2012 would have grown to €1,570,051 with the Stoic 20 profile in 2024, while that would have only been €1,304,841 according to the ProNL index. A difference of €265,210.
The neutral profile.
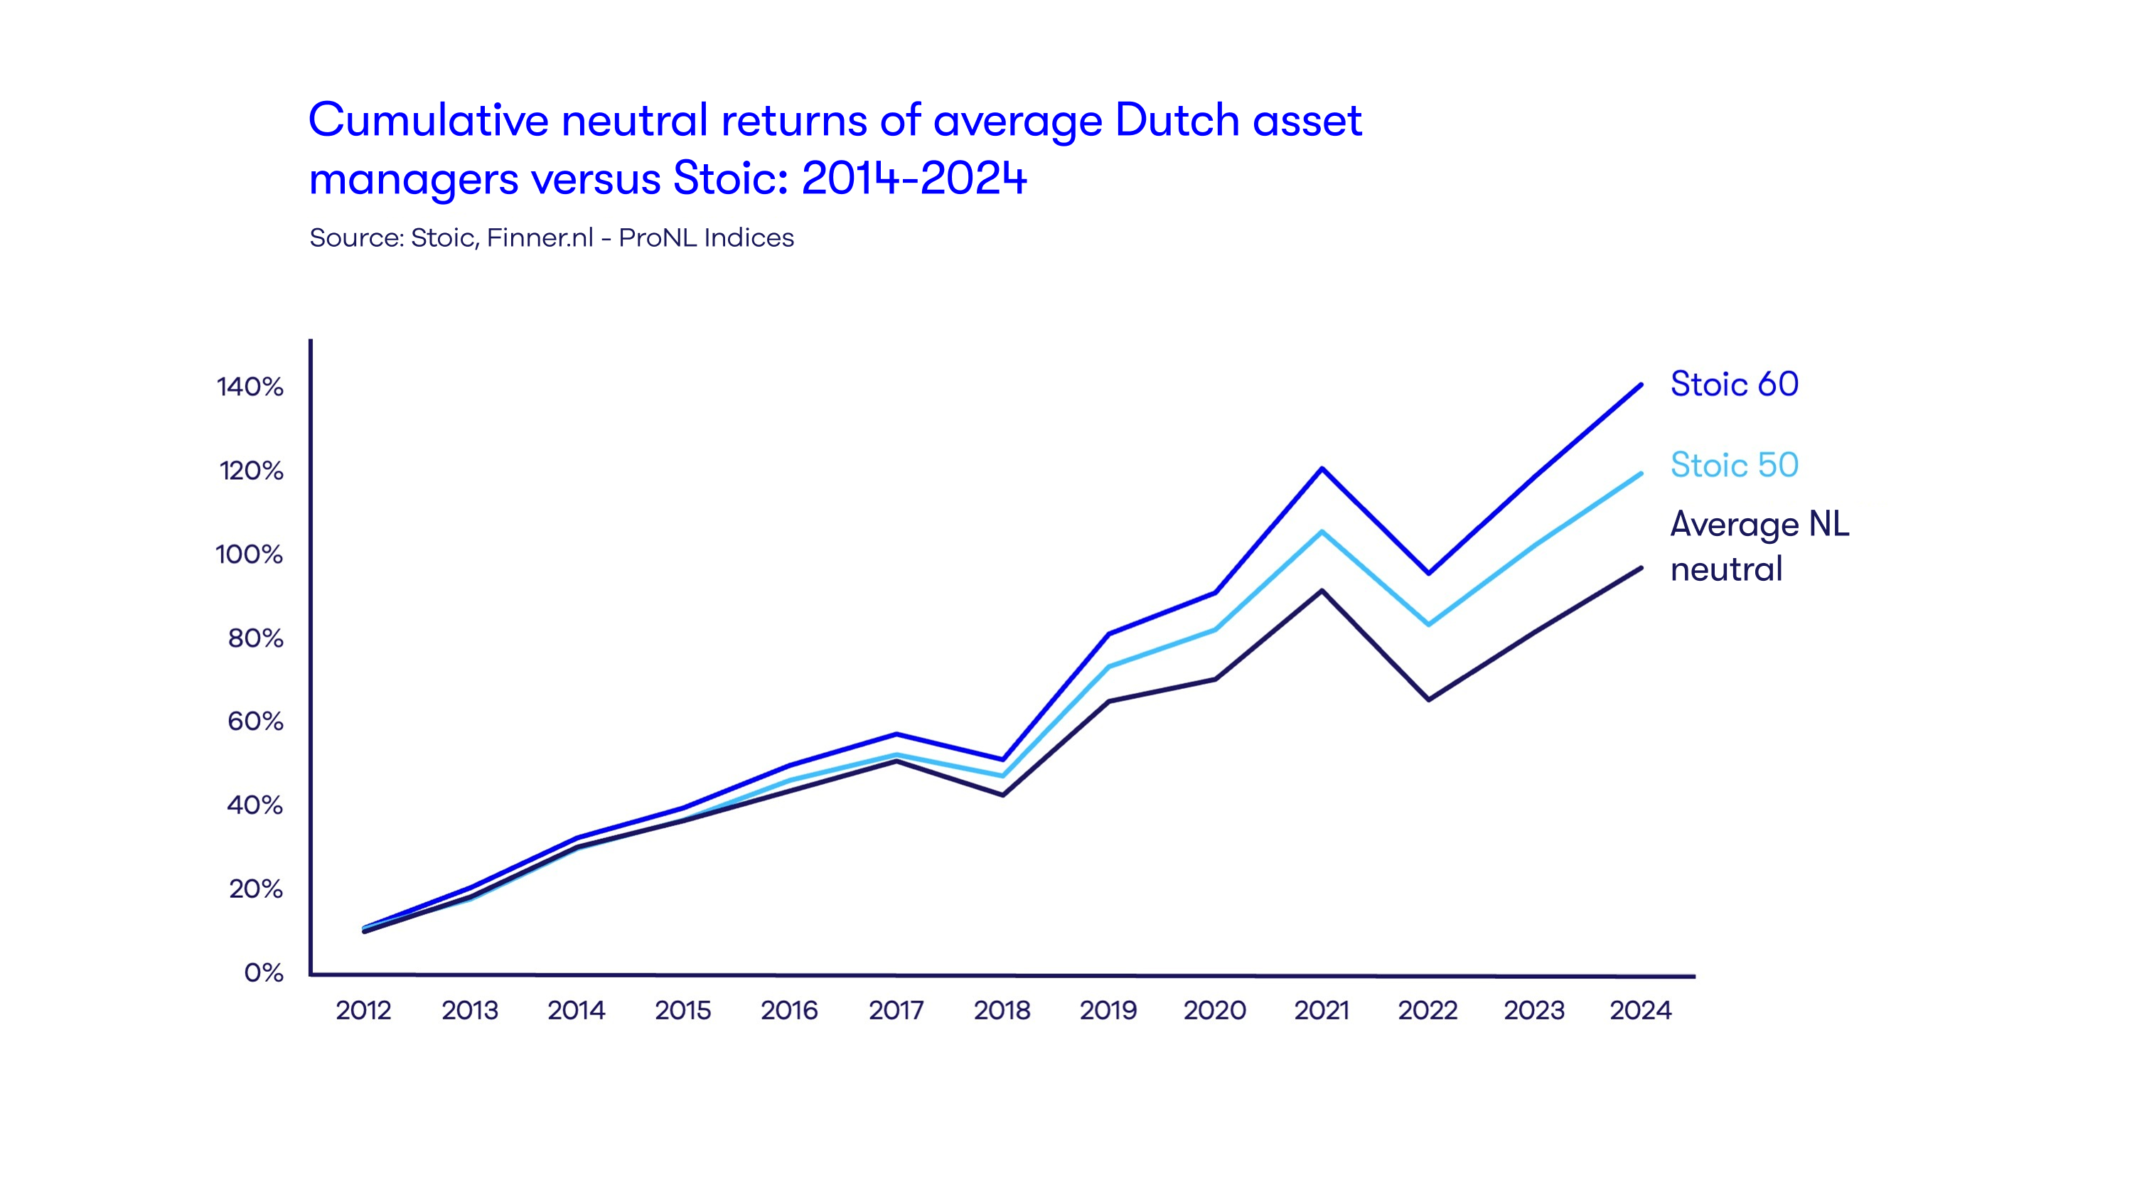
Stoic performs better over the long term in the ‘neutral’ profile. For example, the return from 2012 to the end of Q3 2024 for Stoic 50 is 119.65%, and for Stoic 60, it is 141.00%. That’s significantly more than the return of the neutral ProNL index at 97.12%.
Neutral in concrete amounts.
€1,000,000 invested in 2012 would have grown to €2,409,976 with the Stoic 60 profile in 2024, while that would have only been €1,971,174 according to the ProNL index. A difference of €438,802.
The offensive profiles.
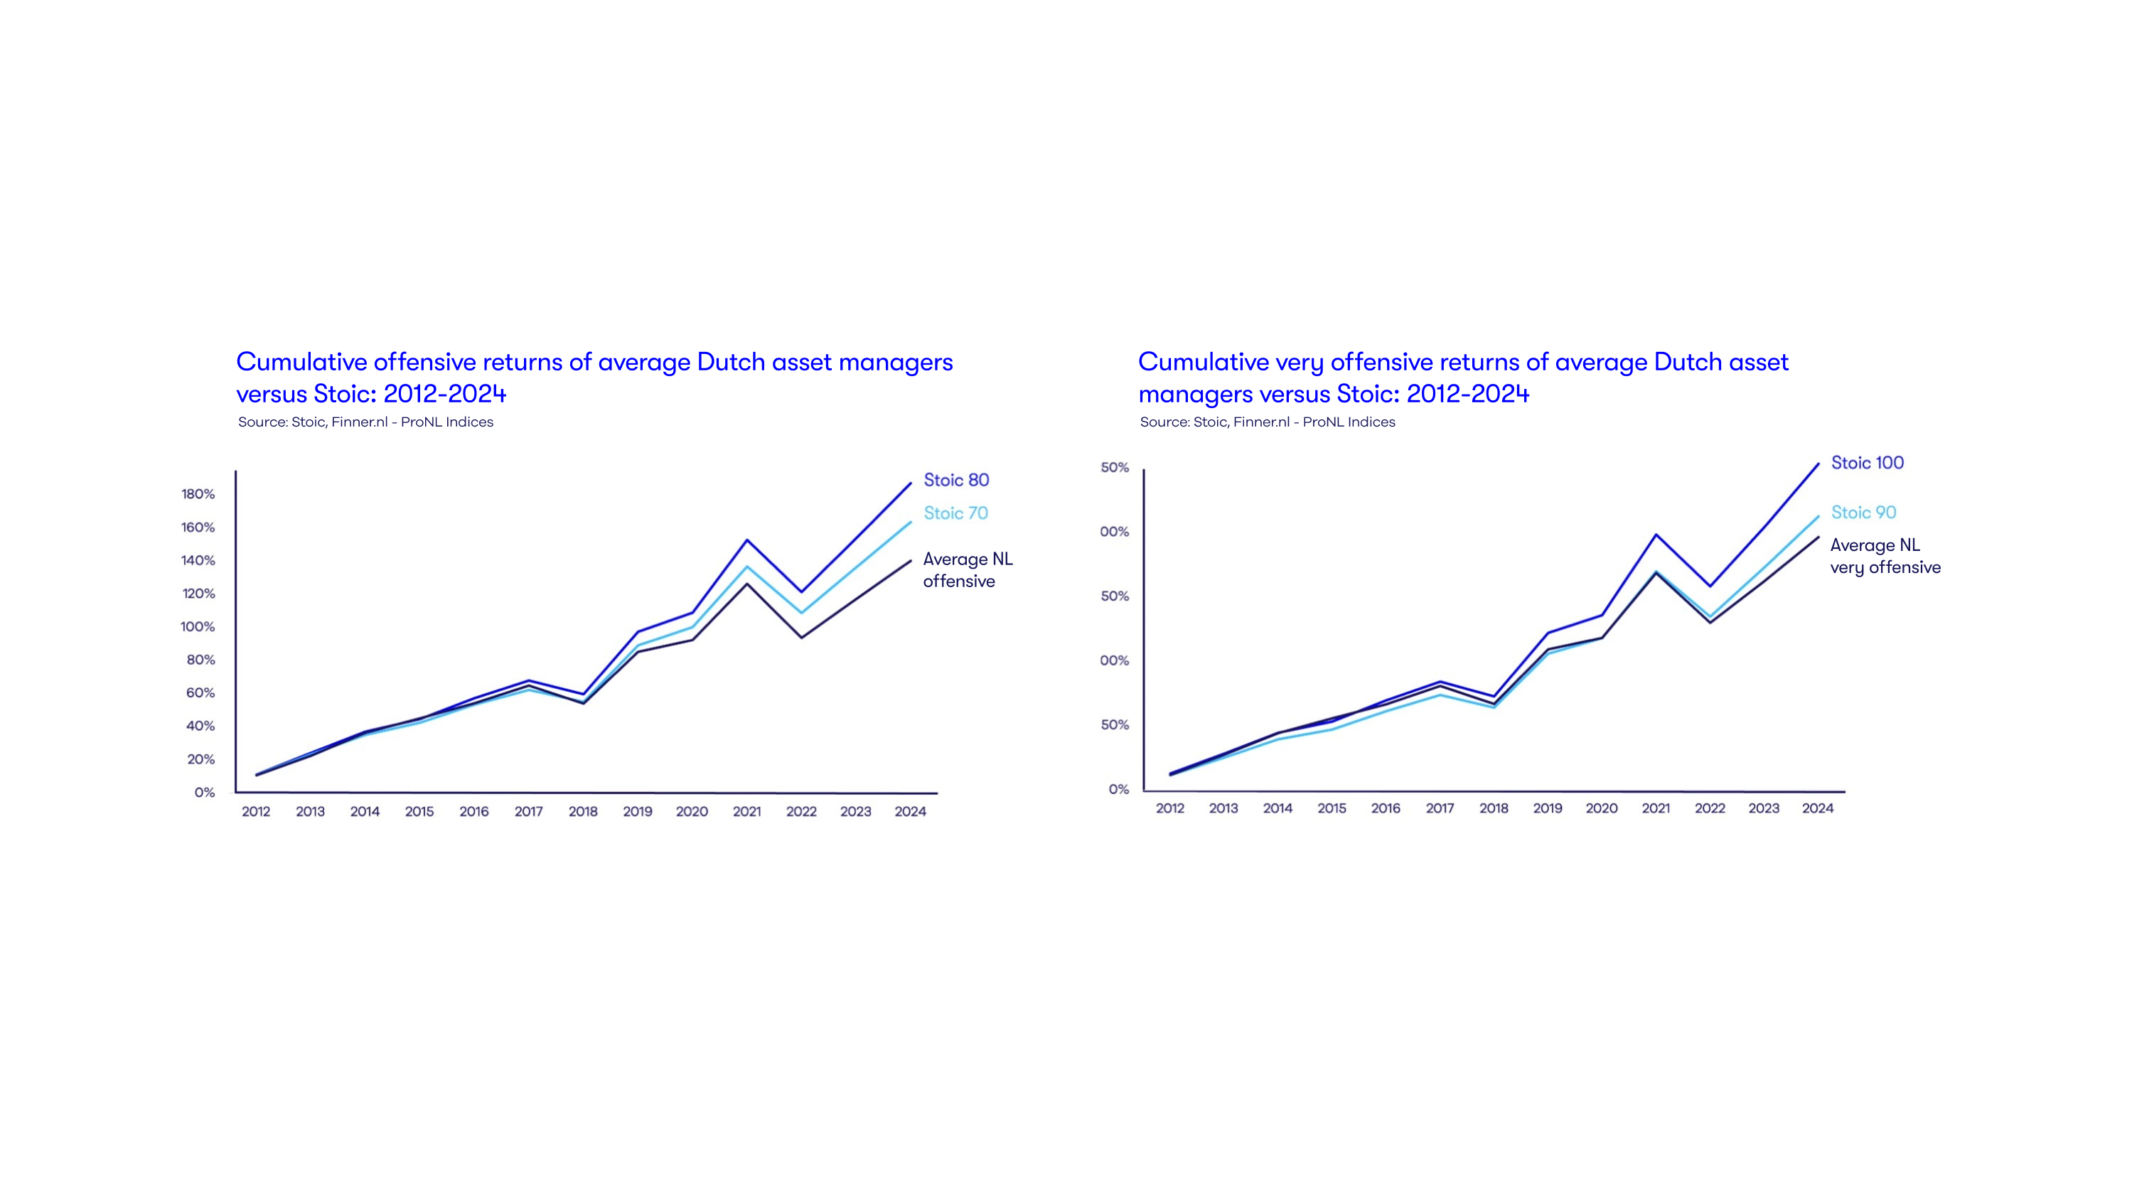
Stoic performs better over the long term in the ‘offensive’ and ‘very offensive’ profiles. For example, the return from 2012 to the end of Q3 2024 for Stoic 90 is 212.66%, and for Stoic 100, it is 253.41%. That’s significantly more than the ‘very offensive’ ProNL index at 196.47%.
In concrete amounts.
€1,000,000 invested in 2012 would have grown to €3,534,068 with the Stoic 100 profile in 2024, while that would have only been €2,964,702 according to the ProNL index. A difference of €569,366.
Conclusion, our stoic investment approach is the best choice in the long run. It is not only good for your money, but also for your peace of mind.

 By Freddy Forger